
Infomaniak creates five new plugins and add-ons for Jelastic Cloud
Published on February 9, 2021 by Team Infomaniak
We’ve designed 5 new plugins and add-ons for Jelastic Cloud users. They’ll allow you to perform antivirus scanning, generate graphics in real time, monitor your nodes (containers) with alerts, and access them directly via SSH.
The easy-to-use Swiss Platform as a Service for developing, hosting and scaling your applications
Jelastic Cloud speeds up the development and roll-out of your applications. This technology offers unique advantages over our other hosting offerings:
- Choice of any technology (Docker, Kubernetes, Node.js, Java, etc.).
- Creation of bespoke infrastructures (load balancing, redundancy, etc.).
- Pay only for the resources actually used.
- Dynamic resizing of resources without interruption.
Curious? Try Jelastic Cloud for 14 days with no obligation
Extensions to facilitate your work with Jelastic Cloud
Our packages are ready to use and install automatically.
Jelastic ClamAV (antivirus)
This tool scans on demand all the files in a container and detects any malicious files, mining and virus codes, etc. It ensures that a critical container is perfectly clean. It also makes it possible to thwart attacks such as code injections. On detection, suspicious files are automatically placed in quarantine and a report generated for the platform administrator.
Jelastic Grafana & Prometheus (data visualisation)
This plugin generates customised graphics by aggregating, in real time, the metrics returned by your containers. Grafana offers a wide range of configuration options and allows you to feed back the data of your choice to produce usage graphs, count registrations, monitor load or e.g. identify the users of a database for marketing purposes. The plugin lets you choose between the open source and enterprise versions (recommended). The version installed by the plugin is always the most recent.
It takes care of the entire installation of Grafana and, so it can be used immediately, returns a URL to connect to the Grafana dashboard with the identifiers.
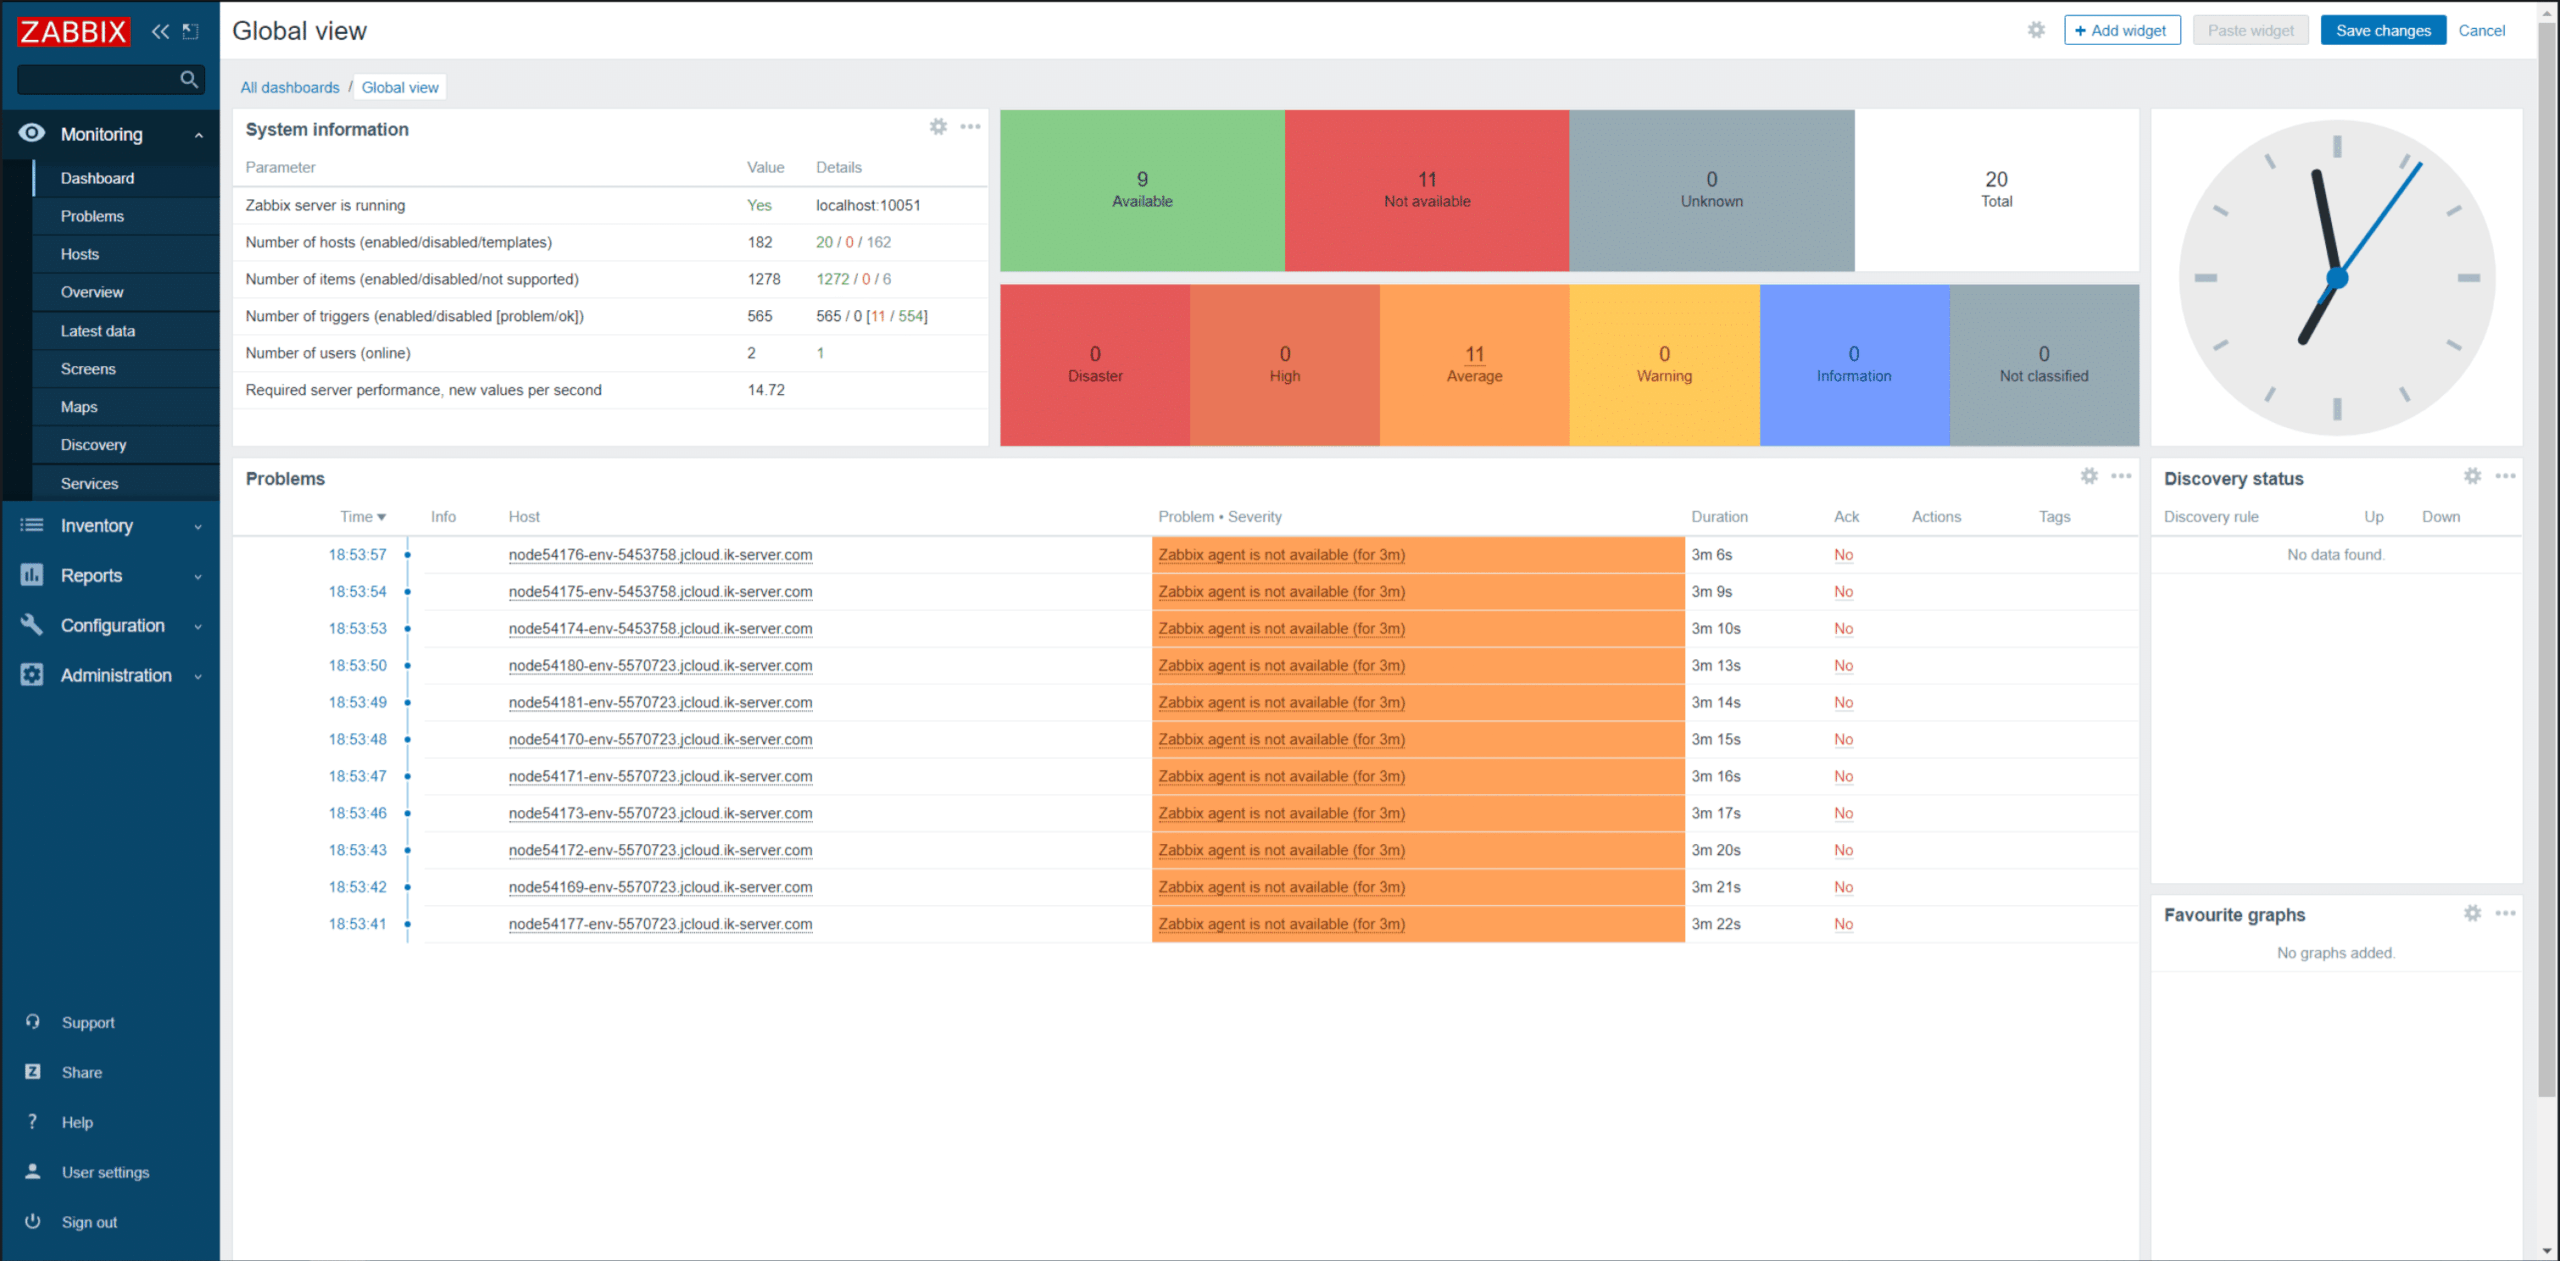
Jelastic Zabbix Server (alerting system)
While Grafana provides excellent graphic representations, Zabbix is used to implement an excellent alerting system. It’s even possible to link the two (see and be informed). The Zabbix plugin allows you to install a server to collect alerts and messages sent by a wizard, which is also installed by the plugin.
Once the Zabbix server has been installed, all you need to do is enter the IP of the container to be monitored. It’s possible to send any type of alert such as emails, SMS texts or pushovers. Customised alert systems can be created with advanced scenarios, e.g. send an alert if a server cannot be reached for more than X consecutive seconds, etc.
There is also a corresponding Zabbix-Agent Addon available which can be installed on any node based on CentOS. On the Addon you can add the internal IP of the Zabbix server or an external IP of an external server for that matter.

Jelastic SSH Direct Access
This tool allows direct access to your containers, without going through Jelastic’s public gateway. Using SSH Direct Access ensures that the web interface is not affected by overloads, which is particularly useful when transferring large files. It also provides emergency access to your servers.
The add-on is based on the SSH private/public key model. Once installed, the container is assigned an IP and an email is received with the command to be performed to connect in SSH. We attach an IPV6 address, which is free for the customer. It’s possible to add additional keys, which have to be entered one-by-one in the add-on interface. To log in, just enter your key – it’s easy.
Making Jelastic Cloud the reference Swiss PaaS
By entrusting your Jelastic server to Infomaniak, you can be sure of benefiting from the most recent version of Jelastic as well as our Cloud infrastructure know-how.
These contributions to the Jelastic ecosystem are designed to allow you to focus on your projects rather than their infrastructure.
We’ll continue to enrich Jelastic’s ecosystem in line with our own use and your needs. Don’t hesitate to send us your ideas and suggestions for add-ons and plugins via Twitter or our support team.
Learn more about Jelastic
- Jelastic Cloud, the easy alternative to AWS and Google Cloud Platform
- Test Jelastic Cloud 14 days without obligation
- Back up your Jelastic servers in the Cloud with Swiss Backup
- How to easily create a clustered WordPress site with Jelastic Cloud
We’ve designed 5 new plugins and add-ons for Jelastic Cloud users. They’ll allow you to perform antivirus scanning, generate graphics in real time, monitor your nodes (containers) with alerts, and access them directly via SSH.
The easy-to-use Swiss Platform as a Service for developing, hosting and scaling your applications
Jelastic Cloud speeds up the development and roll-out of your applications. This technology offers unique advantages over our other hosting offerings:
- Choice of any technology (Docker, Kubernetes, Node.js, Java, etc.).
- Creation of bespoke infrastructures (load balancing, redundancy, etc.).
- Pay only for the resources actually used.
- Dynamic resizing of resources without interruption.
Curious? Try Jelastic Cloud for 14 days with no obligation
Extensions to facilitate your work with Jelastic Cloud
Our packages are ready to use and install automatically.
Jelastic ClamAV (antivirus)
This tool scans on demand all the files in a container and detects any malicious files, mining and virus codes, etc. It ensures that a critical container is perfectly clean. It also makes it possible to thwart attacks such as code injections. On detection, suspicious files are automatically placed in quarantine and a report generated for the platform administrator.
Jelastic Grafana & Prometheus (data visualisation)
This plugin generates customised graphics by aggregating, in real time, the metrics returned by your containers. Grafana offers a wide range of configuration options and allows you to feed back the data of your choice to produce usage graphs, count registrations, monitor load or e.g. identify the users of a database for marketing purposes. The plugin lets you choose between the open source and enterprise versions (recommended). The version installed by the plugin is always the most recent.
It takes care of the entire installation of Grafana and, so it can be used immediately, returns a URL to connect to the Grafana dashboard with the identifiers.
Jelastic Zabbix Server (alerting system)
While Grafana provides excellent graphic representations, Zabbix is used to implement an excellent alerting system. It’s even possible to link the two (see and be informed). The Zabbix plugin allows you to install a server to collect alerts and messages sent by a wizard, which is also installed by the plugin.
Once the Zabbix server has been installed, all you need to do is enter the IP of the container to be monitored. It’s possible to send any type of alert such as emails, SMS texts or pushovers. Customised alert systems can be created with advanced scenarios, e.g. send an alert if a server cannot be reached for more than X consecutive seconds, etc.
There is also a corresponding Zabbix-Agent Addon available which can be installed on any node based on CentOS. On the Addon you can add the internal IP of the Zabbix server or an external IP of an external server for that matter.
Jelastic SSH Direct Access
This tool allows direct access to your containers, without going through Jelastic’s public gateway. Using SSH Direct Access ensures that the web interface is not affected by overloads, which is particularly useful when transferring large files. It also provides emergency access to your servers.
The add-on is based on the SSH private/public key model. Once installed, the container is assigned an IP and an email is received with the command to be performed to connect in SSH. We attach an IPV6 address, which is free for the customer. It’s possible to add additional keys, which have to be entered one-by-one in the add-on interface. To log in, just enter your key – it’s easy.
Making Jelastic Cloud the reference Swiss PaaS
By entrusting your Jelastic server to Infomaniak, you can be sure of benefiting from the most recent version of Jelastic as well as our Cloud infrastructure know-how.
These contributions to the Jelastic ecosystem are designed to allow you to focus on your projects rather than their infrastructure.
We’ll continue to enrich Jelastic’s ecosystem in line with our own use and your needs. Don’t hesitate to send us your ideas and suggestions for add-ons and plugins via Twitter or our support team.


No comments
No comments yet.